Published August 11, 2026
Technician Utilization: How to Measure and Raise It

Technician utilization is the percentage of a technician’s paid hours spent on billable, revenue-generating work. The standard formula: Utilization = Billable Hours ÷ Total Paid Hours × 100. A technician who logs 34 billable hours in a 40-hour week runs at 85% utilization. Once you have that number, three steps follow immediately:
-
Calculate your rate for last week using actual time logs or your FSM software.
-
Compare it to your industry benchmark (55–60% is typical for many field teams; 75–90% for top performers).
-
Pick one lever to test this week — scheduling, route batching, or admin reduction.
Key Takeaways
Technician utilization is the single most direct measure of whether your paid labor hours are generating revenue, and most field teams have meaningful room to improve it.
| Point | Details |
|---|---|
| Use the standard formula | Divide billable hours by total paid hours and multiply by 100 to get your utilization rate. |
| Know your benchmark | Most field teams average 55–60%; top performers reach 75–90% depending on role and trade. |
| Fix definitions first | Lock down what counts as billable before benchmarking, or your trend data will be unreliable. |
| Target five levers | Skills-based dispatch, route clustering, mobile workflows, parts staging, and targeted training produce the most consistent gains. |
| Report at the right cadence | Dispatchers need daily data; supervisors need weekly rollups; owners need monthly trend reports. |
Table of Contents
What does technician utilization actually measure?
Technician utilization measures time allocation, not output quality. That distinction matters more than most managers realize. Productivity, utilization, and capacity are related but genuinely different, and confusing them leads to wrong decisions.
Here is how the three concepts differ in plain terms:
| Metric | What it measures | Example |
|---|---|---|
| Utilization | Actual billable time ÷ total paid time | 34 of 40 hours billed = 85% |
| Productivity | Output quality or volume per unit of time | Jobs completed per shift, first-time-fix rate |
| Occupancy | Billable + productive non-billable time ÷ total paid time | Includes training, travel, prep work |
Utilization applies across field service trades (HVAC, plumbing, electrical, cleaning), veterinary clinical time, shop work, and on-call roles. Each context defines “billable” differently, which is why locking down your definitions before you calculate is the first real task.
How to calculate your technician utilization rate
The standard formula works for most teams. Variants exist for different data situations.
Standard formula: Billable Hours ÷ Total Paid Hours × 100
Common variants:
-
Billable-only utilization: Counts only hours directly invoiced to a client. Strictest version; excludes travel and prep.
-
Occupancy rate: Adds productive non-billable time (travel, pre-job staging, training) to the numerator. Gives a fuller picture of how busy your team actually is.
-
Adjusted utilization: Removes planned leave, holidays, and mandatory training from the denominator. Useful for fair comparisons across technicians with different schedules.
-
Per-shift calculation: Divides billable hours within a single shift by shift length. Good for daily dispatcher reviews.
What counts as billable vs. non-billable:
For field service teams, billable time typically includes on-site labor, diagnostic work, and (when billed to the client) drive time. Non-billable includes internal admin, unanswered on-call hours, training, and travel not passed to the customer.
In veterinary practices, billable clinical time covers patient exams, procedures, treatments, and client education performed by the technician. Non-billable includes staff meetings, inventory management, and cleaning. The AAHA 2023 Technician Utilization Guidelines provide specific recommendations on which tasks should be delegated to technicians to maximize their clinical hours.
Worked example you can copy into a spreadsheet:
-
Pull last week’s time logs for one technician.
-
Sum all hours logged against billable job codes: 34 hours.
-
Confirm total paid hours for the week: 40 hours.
-
Calculate: 34 ÷ 40 × 100 = 85%.
-
Compare to your target range and note the gap.
-
Repeat for each technician and average across the team.
Where does your utilization data actually come from?
Garbage in, garbage out. The accuracy of your utilization rate depends entirely on the quality of your time data.
Primary data sources:
-
Time sheets and job logs: The baseline. Reliable only when technicians complete them consistently and on the same day.
-
FSM software: Platforms that auto-log job start/stop times remove most manual entry errors. Time stamps are tied directly to job records.
-
EHR systems (veterinary): Electronic health records capture procedure times and patient contact hours, making clinical utilization calculations more precise.
-
GPS and telematics: Confirms actual drive times and arrival/departure, which is critical when travel is part of the utilization calculation.
-
Payroll records: The denominator check. Cross-reference paid hours against logged hours to catch gaps.
Reconciling conflicting data:
-
Compare GPS arrival times against manual job-start entries; flag gaps over 15 minutes.
-
Decide upfront whether round-trip travel counts in your numerator, and apply that rule consistently.
-
Flag offline edits in your FSM and require a supervisor sign-off before they post.
-
Run a monthly sample audit: pull five random jobs, interview the technician, and verify the time log matches the invoice.
Pro Tip: Schedule a 30-minute data-audit session at the end of each month. Cross-check your FSM job records against your invoicing system. Discrepancies between billed hours and logged hours are the fastest way to find where utilization is leaking.
What utilization benchmarks should your team be hitting?
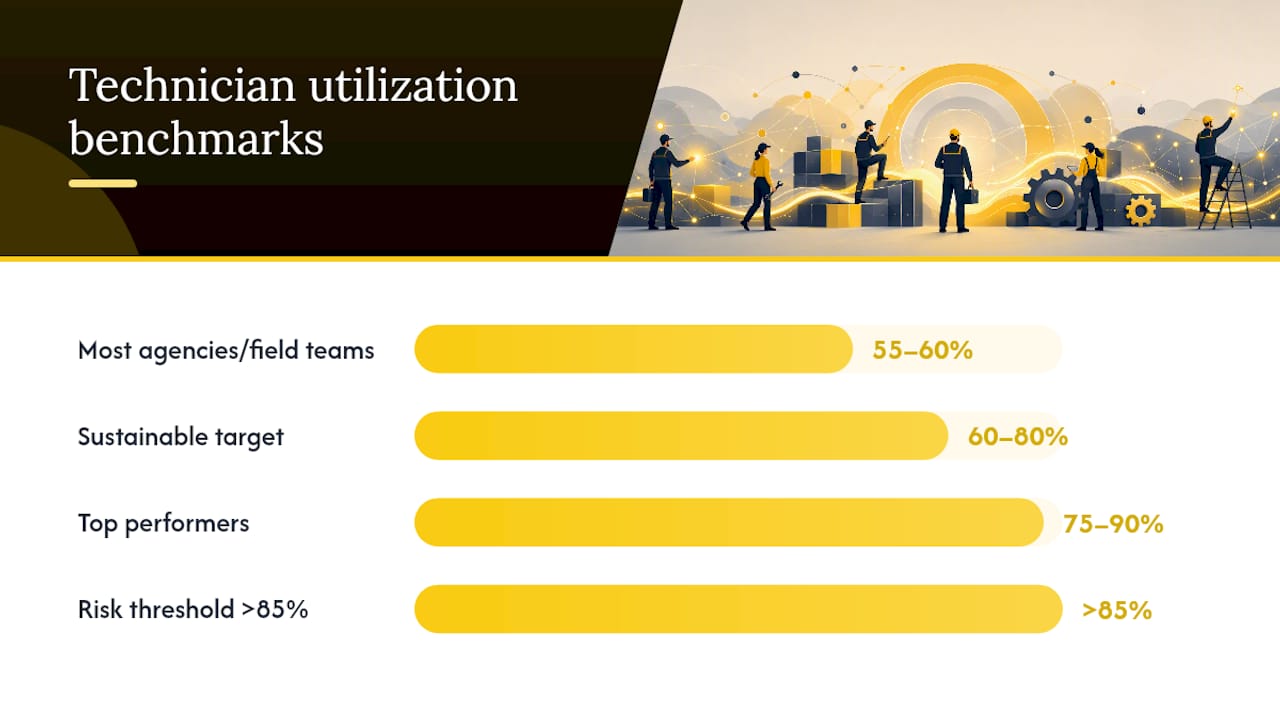
Most agencies and field teams run at about 55–60% utilization, and moving that average up even a few percentage points produces a measurable revenue gain per technician. Top-performing field service operations reach 75–90% depending on role and industry.
Targets shift based on several real factors:
-
Travel intensity: A technician covering a wide rural territory will naturally run lower than one working a dense urban route.
-
Job length and complexity: Short, repeatable jobs (filter changes, routine maintenance) support higher utilization than long diagnostic calls with unpredictable durations.
-
Emergency call volume: Teams that handle a high proportion of reactive calls need buffer capacity, which lowers the realistic target.
-
Role specialization: A senior technician handling escalations will have a different target than a junior tech on routine installs.
For veterinary practices, the AVMA task force has highlighted that technician underutilization is a systemic issue, with many credentialed technicians spending significant time on tasks that could be handled by support staff. The AAHA guidelines recommend auditing which tasks are actually being performed by technicians versus what their credentials allow, as a first step toward setting a realistic clinical utilization target.
To set a business-specific target, start with your billing rate and labor cost. If a technician costs $35/hour fully loaded and bills at $95/hour, you need a minimum utilization rate just to break even on their time. Build your target from that floor, then add a margin goal on top.
Industry signal: Many field service teams target 60–80% as a sustainable operating range. Pushing consistently above 85% without adding capacity tends to increase errors, callbacks, and technician burnout.
Common measurement mistakes that distort your numbers
Wrong utilization numbers are often worse than no numbers, because they drive confident decisions in the wrong direction.
-
Counting travel inconsistently: If you include drive time as billable for some jobs but not others, your rate is meaningless. Decide once, document it, and apply it everywhere.
-
Ignoring admin work in the denominator: If a technician spends two hours on paperwork that isn’t logged anywhere, those hours still count against their paid time. Track them as non-billable, not invisible.
-
Double-counting overlapping jobs: FSM systems that allow job overlap without a flag will inflate billable hours. Audit for jobs where start and end times overlap on the same technician.
-
Failing to normalize for on-call hours: An on-call technician who receives no calls still consumed paid capacity. Decide whether on-call standby hours go in the denominator.
-
Shifting baselines mid-period: If you change what counts as billable partway through a quarter, your trend line is broken. Lock definitions at the start of a measurement period and don’t adjust them until the period closes.
The fix for all of these is the same: write a one-page utilization definition document before you start benchmarking. It should specify exactly what goes in the numerator, what goes in the denominator, and how edge cases (travel, on-call, training) are handled. Share it with every dispatcher and supervisor.
Five practical ways to raise technician utilization
These five tactics produce the most consistent gains for field service and veterinary teams. Start with whichever one addresses your biggest current gap.
-
Skills-based scheduling and intelligent dispatch. Match jobs to technicians by certification, equipment familiarity, and location. Sending the right tech the first time cuts callbacks and frees capacity. Track: first-time-fix rate. Avoiding common scheduling mistakes like over-assigning generalists to specialist jobs is a fast win. Implementation step: tag each technician’s skills in your FSM and require dispatchers to filter by skill before assigning.
-
Route optimization and geo-clustering. Group jobs by geography within each technician’s day. Schedule and route optimization can cut daily miles by roughly 21% and improve first-call resolution by roughly 18% in organizations that implement them. Track: travel hours per technician per day. Pro Tip: Batch your recurring maintenance customers by neighborhood and schedule them on the same day each month. The routing savings compound quickly.
-
Mobile workflows and digital invoicing. Paper-based job completion and manual invoicing pull technicians out of billable time. Mobile checklists, photo capture, and digital invoice management let technicians close jobs on-site without returning to the office. Track: average admin time per job.
-
Pre-job kitting and parts staging. A technician who leaves a job to pick up a part loses an hour or more of billable time. Pre-stage parts the evening before using your job schedule. Materials management software that links parts to specific jobs makes this straightforward. Track: mid-job supply runs per week.
-
Targeted training and first-time-fix readiness. Technicians who arrive without the knowledge or tools to complete a job create callbacks. Short, role-specific training on the top five job types your team handles most often raises first-time-fix rates and reduces wasted travel. For veterinary teams, the WSAVT Tech Utilization resources outline which tasks fall within technician scope, helping clinics assign work at the right level. Track: callback rate by technician and job type.
How to report utilization and keep improving it
A utilization number calculated once and forgotten helps no one. The goal is a reporting rhythm that keeps your team moving in the right direction.
KPIs to pair with utilization:
-
Revenue per technician (connects utilization directly to profitability)
-
First-time-fix rate (quality check alongside the time metric)
-
Travel hours per technician (flags routing inefficiency)
-
Average ticket value (shows whether high utilization is generating proportional revenue)
-
Technician churn rate (a lagging indicator of over-scheduling or burnout)
Recommended reporting cadence:
| Audience | Frequency | Focus |
|---|---|---|
| Dispatchers | Daily / end of shift | Jobs completed, gaps in schedule, travel time |
| Supervisors | Weekly | Utilization by technician, first-time-fix rate, callbacks |
| Business owners | Monthly | Utilization trend, revenue per tech, margin impact |
Dashboard widgets worth building:
-
Utilization trend line (rolling 4-week average per technician)
-
Utilization by technician (ranked, so outliers are visible at a glance)
-
Travel time heatmap (shows which routes or territories are burning the most non-billable hours)
-
Job completion rate (percentage of scheduled jobs completed same-day)
For efficient job scheduling, the reporting setup should feed directly back into how dispatchers assign work the following day.
How ServlyPro helps field teams lift utilization
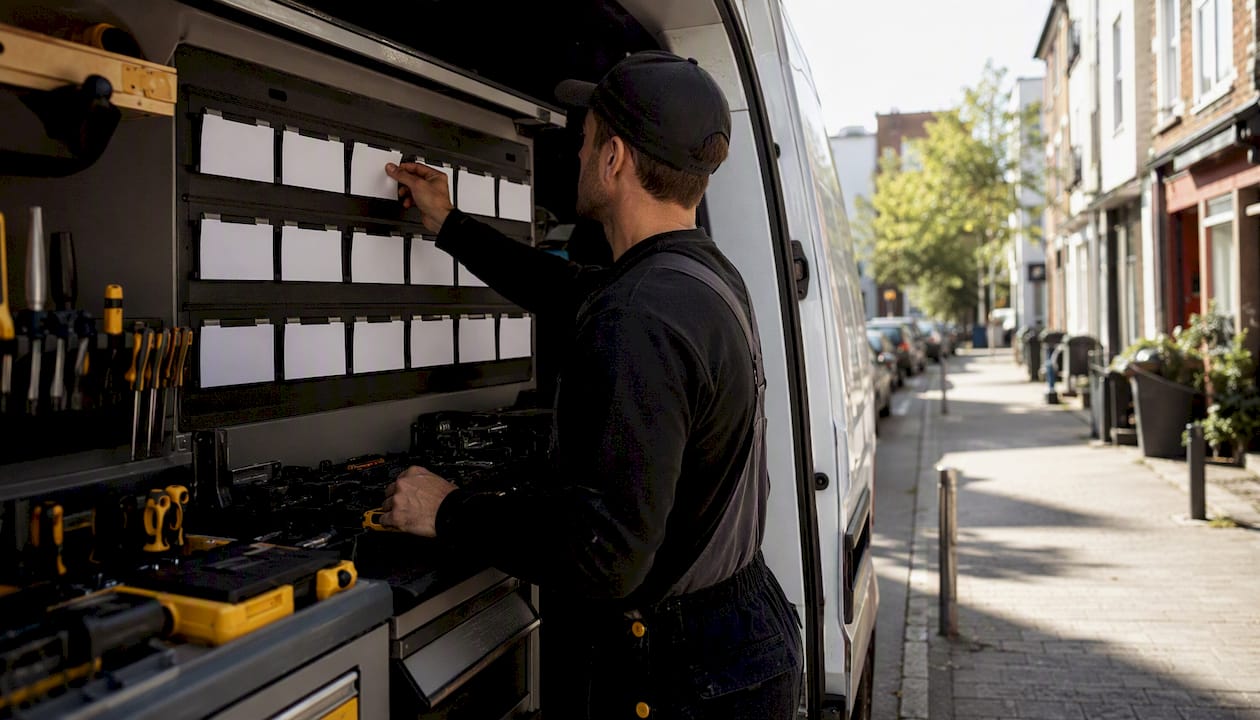
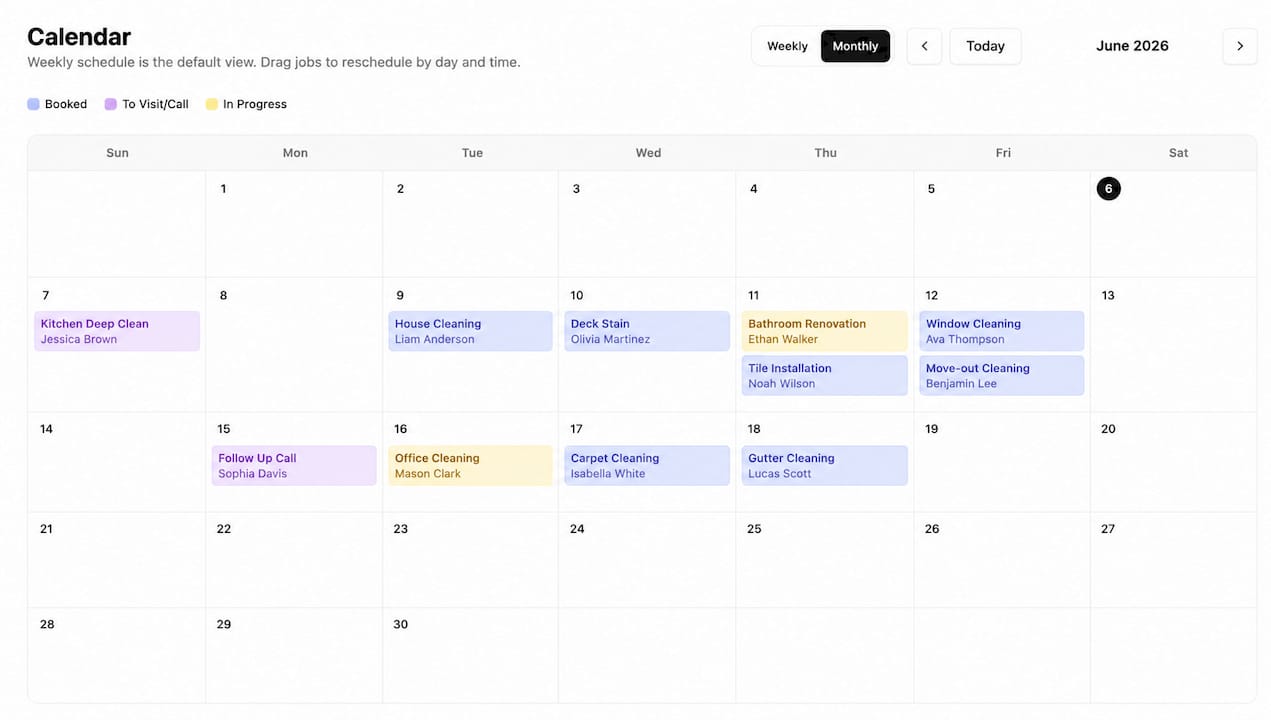
ServlyPro automates the tasks that most commonly drag utilization down: manual scheduling, paper-based job details, disconnected invoicing, and slow quote turnaround. The platform’s job scheduling and calendar tools let dispatchers assign jobs by skill and location, reducing travel time and mismatched assignments. AI-powered quote generation, mobile job checklists, and follow-up automation cut the admin load that pulls technicians away from billable work.
These are vendor-reported figures and should be validated through a structured pilot before you build them into a business case.
Capabilities that directly affect utilization:
-
Drag-and-drop job scheduling with skills and location filters
-
AI quote generator that reduces quoting time per job
-
Mobile job details and photo capture for on-site job closure
-
Automated follow-up for quotes and invoices
-
Real-time dashboards showing jobs completed, technician status, and revenue
Run a 30–90 day pilot before committing to any platform. Track three metrics before and after: travel hours per technician per week, jobs completed per technician per day, and average admin time per job. Those three numbers will tell you whether the software is moving your utilization in the right direction.
Pilot KPI checklist:
-
Baseline travel hours per tech (week 1)
-
Baseline jobs per tech per day (week 1)
-
Re-measure at day 30 and day 90
-
Compare first-time-fix rate before and after skills-based dispatch goes live
Field service management software for U.S. contractors like ServlyPro is built to connect scheduling, dispatch, and reporting in one place, so the data you need for utilization tracking is already there.
Utilization metrics work best when your team trusts them
The most common mistake managers make with utilization data is using it as a performance punishment tool rather than a systems diagnostic. When technicians believe their utilization score is being used to justify discipline, they game the numbers: logging travel as billable, padding job times, or rushing through work to hit a target. The metric becomes unreliable, and the underlying problems stay hidden.
A more effective approach treats utilization as a health check on your scheduling, routing, and admin systems. When a technician’s rate drops, the first question should be “what in the system is creating that gap?” not “what is wrong with that person?” Often the answer is a scheduling gap, a parts shortage, or an admin task that should have been automated.
That level is sustainable for short periods, but when it becomes the norm, callbacks increase, quality drops, and technician turnover follows. Involve your technicians in the planning process. When they understand what the metric measures and how improvements benefit them, including through shared incentives tied to efficiency gains, they become active contributors to raising it rather than passive subjects of it.
Utilization data is most powerful when it removes friction from your team’s day, not when it adds pressure to it.
Sources
The following sources informed this article and are worth bookmarking for ongoing reference:
For vendor-reported outcomes, always validate with a structured pilot. A 30–90 day trial with clear before-and-after KPIs is the only reliable way to confirm whether a software platform will move your specific utilization numbers.